Framework: Enabling the Business Department for Self-Service BI with Power BI
Introducing Self-Service BI with Power BI: Transforming Reporting in the Controlling Department
In many organizations, the controlling department still relies heavily on manual Excel-based reporting. While Excel has been the standard tool for decades, the growing complexity of business data, the demand for faster insights, and the need for collaboration make manual reporting increasingly inefficient.
Self-service business intelligence (BI) with Power BI changes this landscape. By shifting from static spreadsheets to automated, interactive reporting, controllers can spend less time preparing data and more time analyzing it.
The Challenge with Traditional Excel Reporting
For many finance and controlling teams, monthly and weekly reporting often looks the same:
Manual data exports from ERP or accounting systems
Copy-paste into Excel templates
Multiple versions of spreadsheets circulated by emai
High risk of errors and inconsistent numbers
This repetitive workload consumes valuable time and leaves little room for true financial analysis. It also makes real-time insights nearly impossible.
How Power BI Enables Self-Service BI
Power BI provides a platform where data is connected once, refreshed automatically, and visualized in interactive dashboards. For controlling teams, this means:
Automated Data Integration
Instead of exporting data into Excel manually, Power BI connects directly to ERP, CRM, and financial systems. Data updates can be scheduled, reducing the effort needed for every reporting cycle.
Paginated Reports for Financial Statements
With Paginated Reports, controllers can generate pixel-perfect, print-ready documents that look just like traditional financial reports. These reports can be scheduled and automatically delivered by email, ensuring stakeholders always receive the latest numbers without manual preparation.
Fabric as the Data Foundation
Microsoft Fabric provides the underlying data platform, centralizing all financial and operational data in OneLake. This ensures that controllers work with consistent, governed datasets. By removing data silos, analyses become more reliable and comparable across the organization.
Self-Service Dashboards
Controllers can build their own dashboards to track KPIs such as revenue, cost structures, or cash flow. Executives can interact with these dashboards in real time, drilling down from high-level summaries to transaction-level details without needing additional Excel exports.
Business Impact for the Controlling Department
By adopting self-service BI with Power BI and Fabric, controlling teams benefit from:
Time savings: Automated refreshes replace manual data preparation.
Accuracy: Reports are generated from a single source of truth, reducing the risk of errors.
Agility: Reports and dashboards can be adapted quickly to changing business needs.
Scalability: Paginated Reports and Power BI Service allow reports to be delivered consistently across the organization.
Instead of spending days preparing monthly reports, controllers can focus on strategic analysis, forecasting, and advising management.
Conclusion
The shift from manual Excel reporting to self-service BI with Power BI represents a major opportunity for controlling departments. By combining the strengths of Power BI dashboards, Paginated Reports, and Microsoft Fabric, organizations can modernize their reporting processes, increase accuracy, and empower controllers to act as true business partners.
The future of controlling lies not in preparing spreadsheets, but in delivering insights that guide smarter decisions. Power BI makes that future a reality today.
Example: Controlling Department
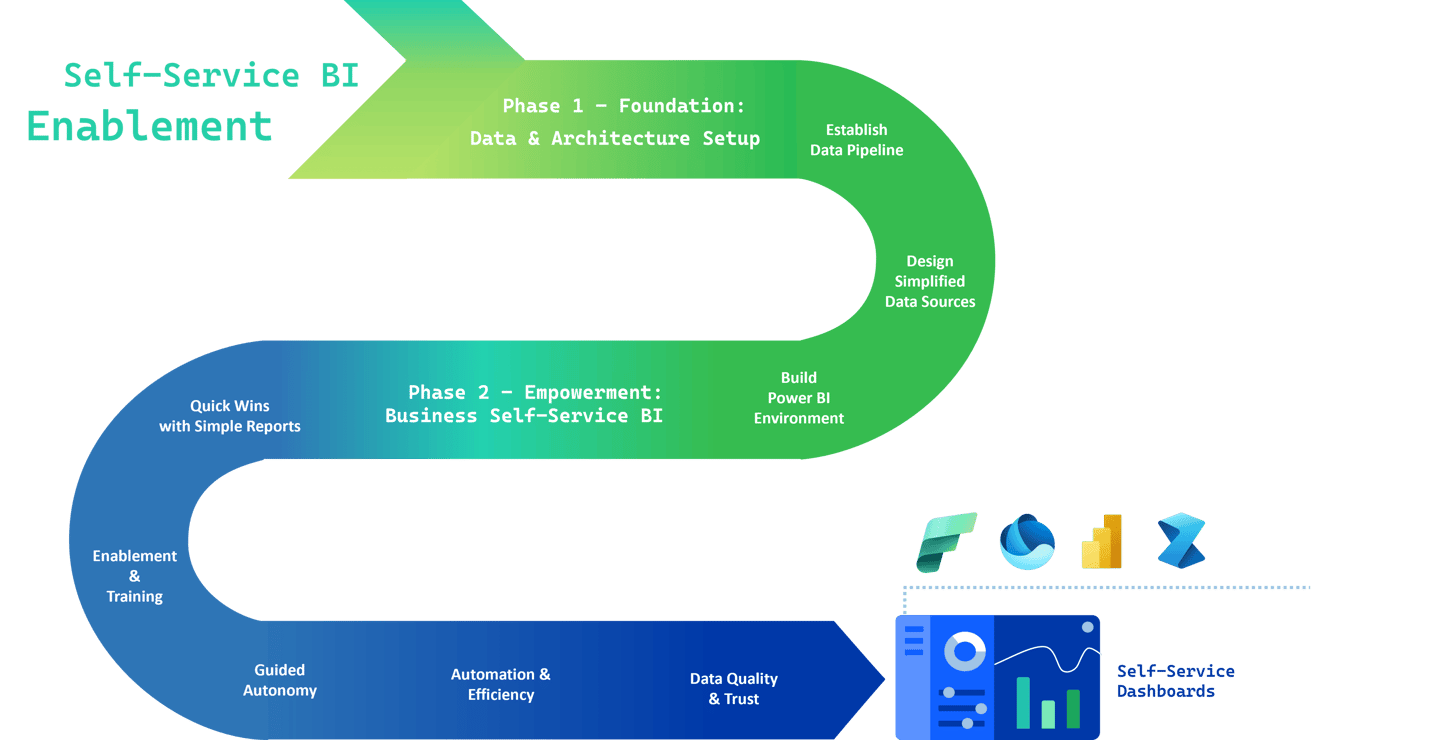
Phase 1 – Foundation: Data & Architecture Setup
Establish Data Pipeline
• Connect source systems (Oracle, SQL Server, PostgreSQL, etc.)
• Implement Medallion architecture in Microsoft Fabric (Bronze → Silver → Gold)
• Ensure data is cleansed, conformed, and business-ready
Design Simplified Data Sources
Create simple data marts in the Gold Layer
Predefine key KPIs and measures relevant for Controlling
Keep structures intuitive to minimize training needs
Build Power BI Environment
Set up workspace structure, governance, and access rights
Enable integration with Fabric Warehouse (direct, simple connection)
Provide standard datasets as a baseline for reporting
Phase 2 – Empowerment: Business Self-Service BI
Quick Wins with Simple Reports
Deliver prebuilt starter dashboards as examples
Allow Controlling users to copy and adapt templates
Focus on immediate value creation (daily/weekly reporting)
Enablement & Training
Short, focused training sessions (max. 1–2 hours)
Teach basics: navigation, visuals, filtering, exporting
Emphasize “learning by doing” instead of long theory
Guided Autonomy
Controlling builds its own Power BI reports and dashboards
BI team supports only when advanced modeling or complex needs arise
Encourage a culture of self-service first, BI support second
Automation & Efficiency
Use Power BI Paginated Reports for automated daily delivery
Enable Power BI reports and dashboards for interactive self-service analysis
Reduce manual reporting workload in Controlling
Data Quality & Trust
Activator ensures validation rules and alerts for data quality
Clear communication: users can trust the Gold Layer data
Minimize the need for cross-checking in Excel
Key Success Factors
Keep it simple: Minimal complexity in datasets and reports
Fast adoption: Provide ready-to-use data and templates
Low time investment: Short training, intuitive data models
Support structure: BI team available for complex needs, not for every report
Trust in data: Reliable Gold Layer ensures confidence in self-service

Contact Us
Get in touch to transform your data into business value.
MB Data Expertise
Transforming data into actionable
business intelligence solutions.
© 2026. All rights reserved.