
How Controllers Can Save Time with Self-Service BI in Power BI
2 min read
For many finance and controlling departments, reporting is still dominated by manual processes in Excel. Month-end closings, variance analyses, and management reports often involve endless copy-paste operations, data reconciliation, and error checking. This manual workload consumes valuable time that controllers could spend on strategic analysis and decision support.
Self-Service BI with Power BI offers a modern alternative. By automating data refreshes, standardizing reports, and enabling interactive dashboards, controllers can reduce repetitive tasks and focus on providing insights.
The Traditional Reporting Challenge
Controllers are responsible for delivering accurate, timely reports to management. In many organizations, this involves:
Exporting data from ERP or accounting systems
Consolidating information in Excel workbooks
Preparing charts and tables manually
Emailing multiple versions to stakeholders
These processes are time-intensive, error-prone, and difficult to scale. As organizations grow, the complexity of reporting increases, and controllers often find themselves spending more time preparing data than analyzing it.
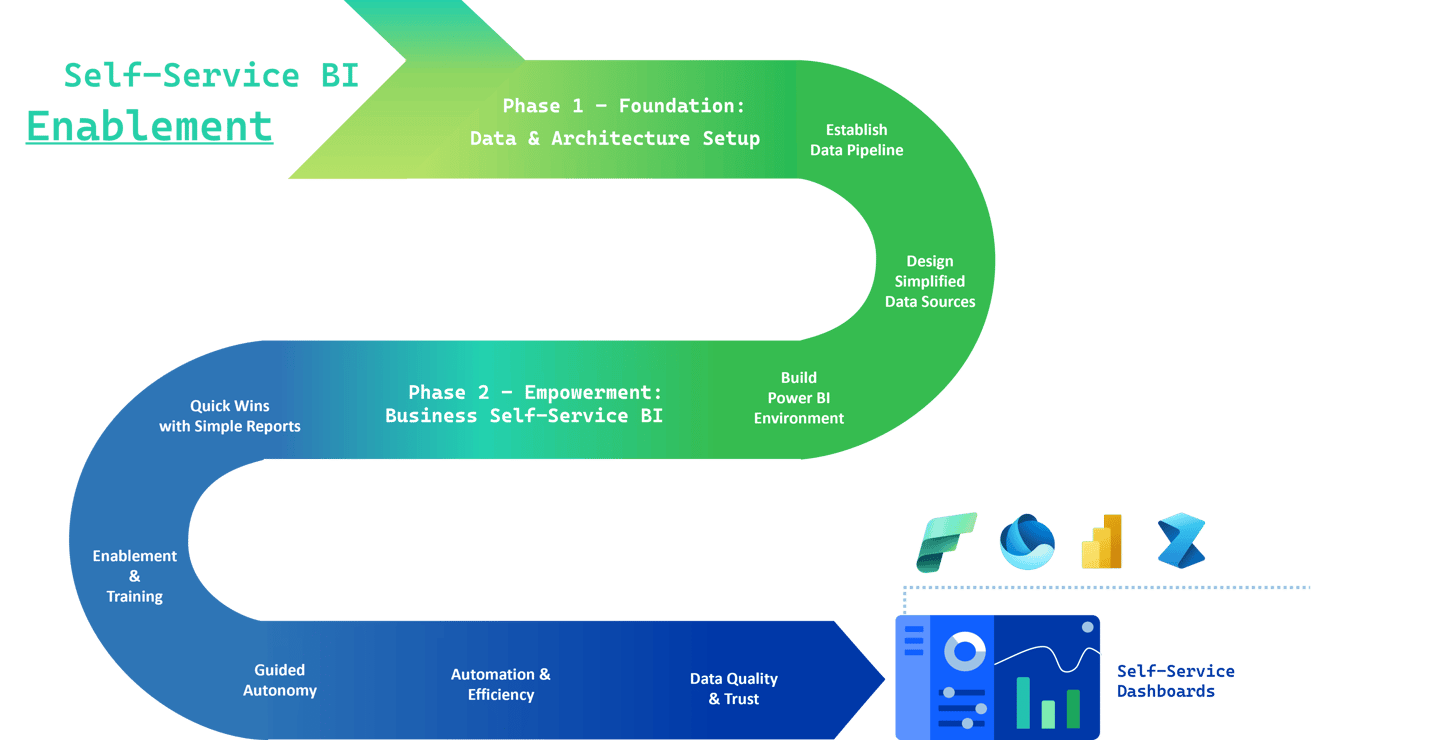
How Self-Service BI with Power BI Helps
Automated Data Connections
Power BI connects directly to ERP, CRM, and other business systems. Instead of manual exports, data pipelines are automated, ensuring that controllers always work with up-to-date information.
Interactive Dashboards Instead of Static Reports
Power BI allows controllers to design dashboards where managers can drill down into details themselves. This reduces the need for endless report variations and frees controllers from repetitive customization tasks.
Paginated Reports for Financial Statements
For highly formatted reports such as balance sheets or income statements, Paginated Reports in Power BI provide pixel-perfect layouts. These can be scheduled for automatic distribution, saving hours of manual formatting.
Integration with Microsoft Fabric
By using Microsoft Fabric as a central data platform, controllers gain access to consistent, governed datasets. This eliminates version conflicts and ensures everyone is working with the same numbers.
Self-Service Analysis for Business Users
When business users can run their own queries and visualizations in Power BI, controllers are no longer the bottleneck for every reporting request. This decentralizes routine analysis and saves controllers significant time.
Business Impact for Controlling Departments
By adopting self-service BI with Power BI, controlling teams can achieve:
Time savings through automation of data refresh and report delivery
Higher accuracy by relying on governed, centralized datasets
Improved agility to adapt reports and dashboards to new business needs quickly
Stronger strategic role as controllers focus more on interpretation and advice than on manual data preparation
Conclusion
Self-Service BI with Power BI represents a significant opportunity for controlling departments. By reducing manual reporting work, enabling interactive dashboards, and automating paginated financial reports, controllers can save valuable time and shift their focus toward analysis and strategic guidance.
The result is not only more efficient reporting processes but also a controlling department that adds greater value to the business.
MB Data Expertise
Transforming data into actionable
business intelligence solutions.
© 2026. All rights reserved.